Technically Speaking....
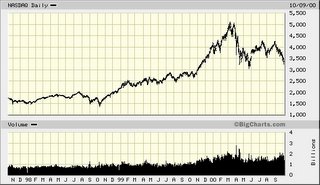 To the left is a chart from BigCharts.com that shows the NASDAQ over a 3 year period of 10/97 to 10/2000. This was during the market "bubble" and right before the proverbial fecal matter hit the fan. We all remember how it was "different this time", and how Greenspan & Co. had engineered a "new paradigm." Fundamental like earnings, sales, cash flow, were obsolete. Technical analysis was for fools. You had to buy now or pay more later for such darlings as Priceline, JDS Uniphase, and EMC.
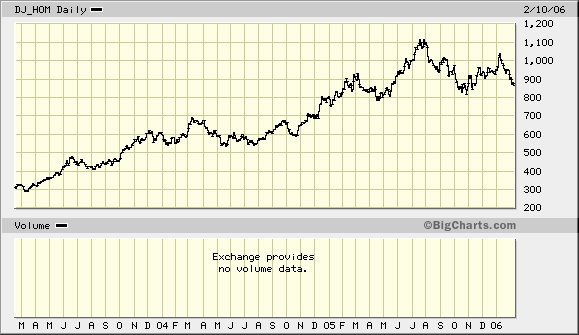 Ok, here is a current 3 year chart of the Dow Jones Home Builders Index, again from BigCharts.com . Although not exact, the overall chart patterns are similar, characterized by huge runs to the upside at valuations that are not sustainable or explainable. Currently, the P/E on this index even after coming down some 30% off the high is around 30. We all know what happened in the year 2001 and beyond to the NASDAQ. trading patterns do tend to repeat themselves. If one were to follow this logic, then this is what one might expect to happen.
 Here is a chart of the NASDAQ from the peak (March 2000) to the present. It is still some 50% off over five years later after falling over 80%. Now you might say stocks and real estate are totally different,and that stocks are more speculative. My point is charts tell us money is always flowing- either in or out of an asset. Considering real estate has morphed from being a place to live in to a place to make money on, I would not be surprised if history repeats itself.
posted by BigDaddy63 @ 7:52 PM
1 comments
![]()
![]()


1 Comments:
Does anyone know anyone who has sold anything in broward in the past 30-60 days. As someone trying to sell my home(non investment) I'm starting to freak out. Anyone, any offers at all?
Post a Comment
<< Home